Hey Everyone, and Happy Thanksgiving, While we all have plenty to be thankful for, health, family and friends, I figured I would show my appreciation to all of you from the blog and the great people I have met though this wonderful game and blog site. Peter has been rolling out his All Decade teams of the last decade and it got me thinking about (of course) what the 1990s Cleveland Indians all decade team would look like due to the late 90s success they had. Many discussions with Peter later we stumbled upon an article from bleacher report ranking the top 100 everyday players of the 1990s. Now this seemed like a fun and daunting task to take on, I embraced it and went all in. I put every player into my spreadsheet and got to work, Now before I get into the cards, I would like to discuss my process that I was using to determine which season to use per player.
My Process:
Listing each player was the easy part, I opened a second tab and had Peters chart calculations open as well and a third tab with fangraphs of each years top 300 batters on base rankings. I went through each individual players pages looking at which year was the best season that they had. For many, the process stopped there and I would take that seasons statistics and generate the players card. If that particular season had been made by all the talented people we have or if it was the 1999 season, which the 2000 set was based upon, I would pick a different season that they had success in, while a few that season was so good I had to just remake it for a higher quality card. If your favorite season of a player didn't make it in, I apologize but man these cards are going to be fun to add in to some showdown slug fests.
My plan in this article is if we made a different version of a player that made the list from the 90s, I am going to try to include that card as well so this is going to be a loaded post with tons of cards for you to print out and add to your collections. It is also funny to look at some of my original cards and how terrible the cutouts were, and to look back at Peters original posts with his initial style of card before Bob blessed us all with the original showdown templates.

Honorable Mention: Now when I first started I said I was thinking 90s Indians all decade, and I made the first card, 1997 Sandy Alomar, who did not make the top 100, so I may as well include his card in this post too.

In 1997 Sandy Alomar was the All Star Game MVP in Cleveland, also in the 90s he was the 1990 Rookie of the Year, and a 6 time all star
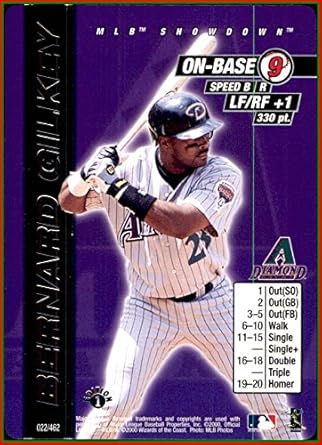
100. Bernard Gilkey (1996)

.393 OB% .317 AVG 44 2Bs 30 HRs 17 SBs
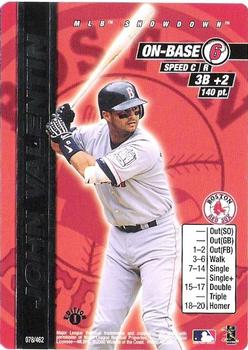
99. John Valentin (1995)

.399OB% .298AVG 37 2Bs 27 HRs 20 SBs
98. Danny Tartabull (1991)

.397OB% .316AVG 35 2Bs 31 HRs
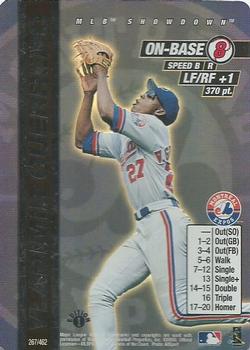
97. Vladimir Guerrero (1998)

.371OB% .324AVG 37 2Bs 7 3Bs 38 HRs
96. Jim Edmonds (1995)

.352OB% .290AVG 30 2Bs 33 HRs
(S/O Peter for making this card)
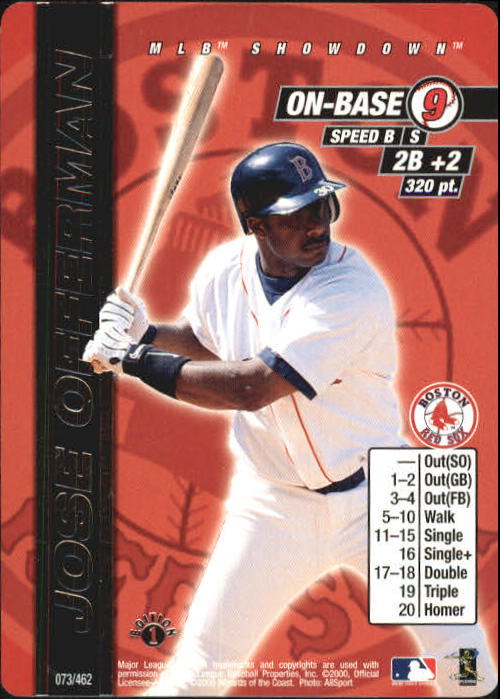
95. Jose Offerman (1996)

.384OB% .303AVG 33 2Bs 8 3Bs 5 HRs 24 Sbs
94. Hal Morris (1994)

.385OB% .335AVG 30 2Bs 4 3Bs 10 Hrs
93. Ruben Sierra (1991)

.357OB% .307AVG 44 2Bs 5 3Bs 25 Hrs 16 SBs
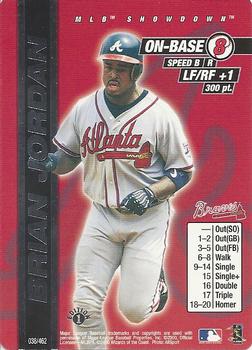
92. Brian Jordan (1997)

.368OB% .316AVG 34 2Bs 7 3Bs 25 HRs 17 SBs
91. Brett Butler (1992)

.413OB% .309AVG 11 3Bs 41 SBs
90. Tim Raines (1992)

.380OB% .294AVG 22 2Bs 9 3Bs 45 SBs
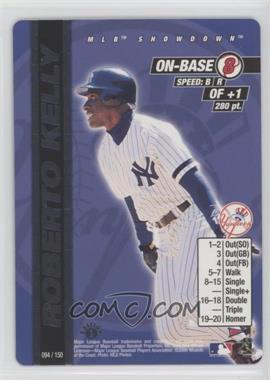
89. Roberto Kelly (1991)

.333OB% .267AVG 22 2Bs 20 HRs 32 SBs
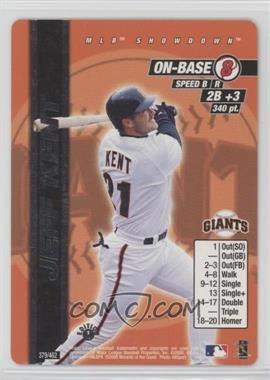
88. Jeff Kent (1998)

.359OB% .297AVG 37 2Bs 31 HRs
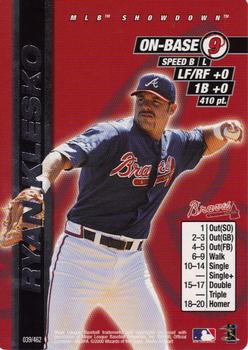
87. Ryan Klesko (1996)

.364OB% .282AVG 21 2Bs 4 3Bs 34 HRs


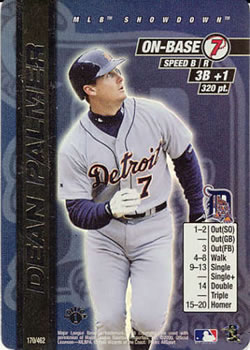
86. Dean Palmer (1996)

.348OB% .280AVG 26 2Bs 38 HRs
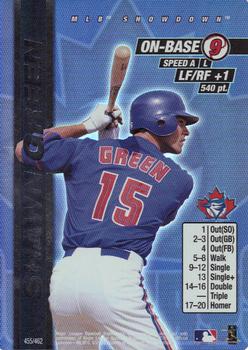
85. Shawn Green (1998)

.334OB% .278AVG 33 2Bs 4 3Bs 35HRs
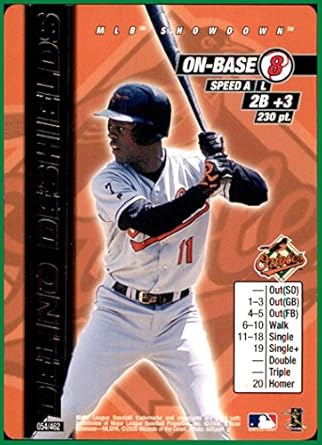
84. Delino Deshields (1997)

.357OB% .295AVG 26 2Bs 14 3Bs 11 HRs 55 SBs
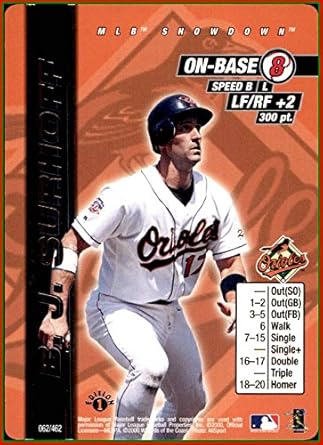
83. BJ Surhoff (1993)

.318OB% .274AVG 38 2Bs 7 HRs

82. Lance Johnson (1996)

.362OB% .333AVG 31 2Bs 21 3Bs 50 SBs

81. Julio Franco (1994)

.406OB% .318AVG 19 2Bs 20 HRs
80. Lenny Dykstra (1993)

.420OB% .305AVG 44 2Bs 6 3Bs 19 HRs 37 SBs
79. John Kruk (1993)

.430OB% .316AVG 33 2Bs
78. Gregg Jeffries (1990)

.337OB% .283AVG 40 2Bs 15 HRs
77. Luis Gonzalez (1993)

.361OB% .300AVG 34 2Bs 15 HRs 20 SBs

76. Wally Joyner (1991)


75. Mickey Tettleton (1993)

.372OB% .245AVG 25 2Bs 32 HRs
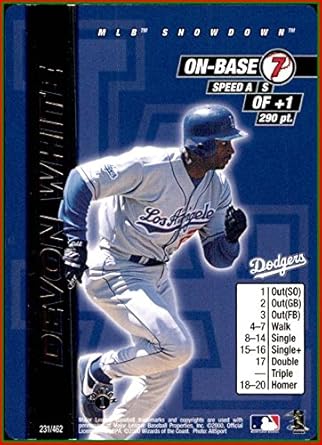
74. Devon White (1991)

.342OB% .282AVG 40 2Bs 10 3Bs 17 HRs 33 SBs


73. Carlos Baerga (1992)

.354OB% .312AVG 32 2Bs 20 HRs

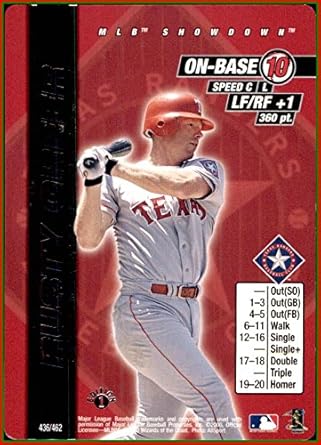
72. Rusty Greer (1997)

.405OB% .321AVG 42 2Bs 26 HRs
71. Eric Karros (1995)

.369OB% .298AVG 29 2Bs 32 HRs

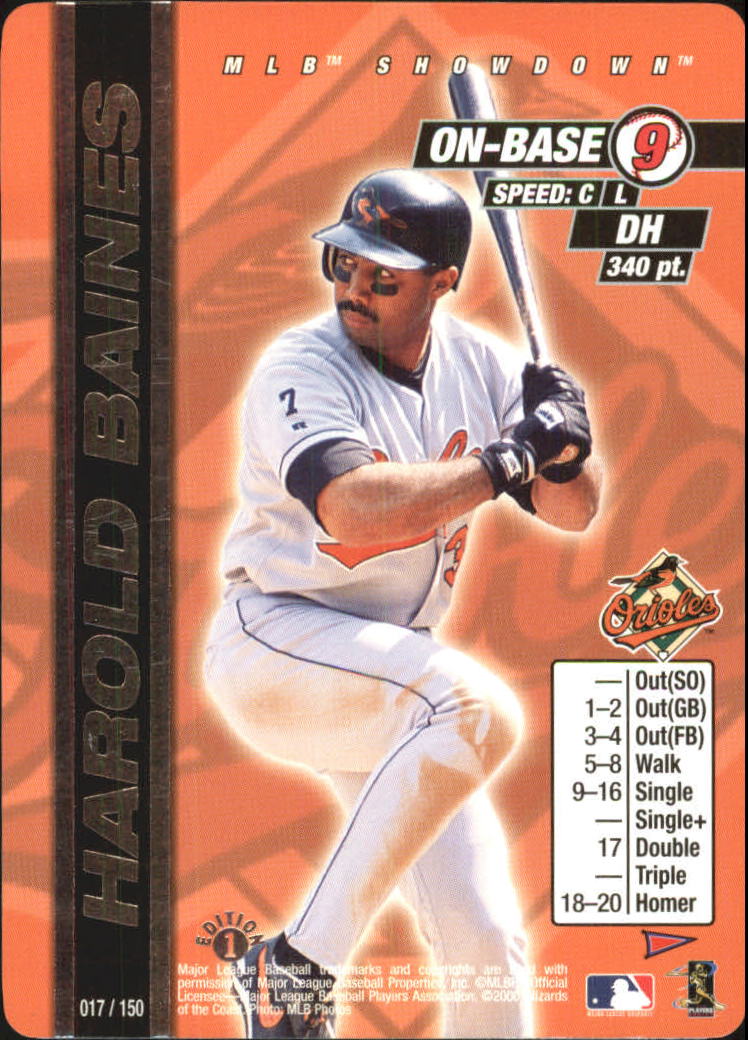
70. Harold Baines (1996)

.399OB% .311AVG 29 2Bs 22 HRs


69. Todd Zeile (1993)

.352OB% .277AVG 36 2Bs 17 HRs

68. Tony Phillips (1995)

.394OB% .261AVG 21 2Bs 27 HRs

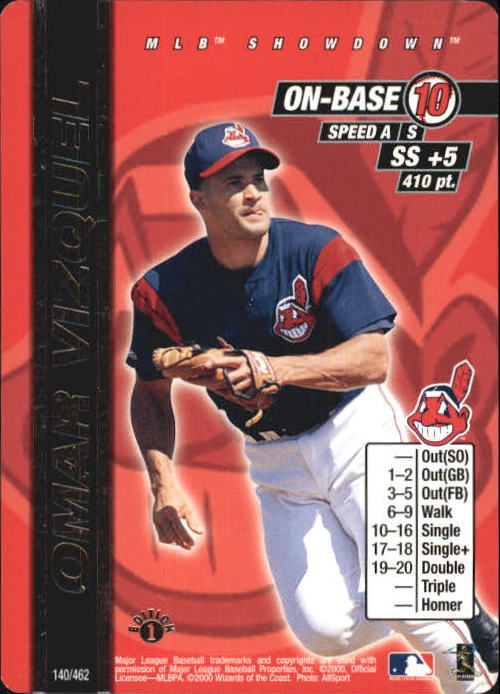
67. Omar Vizquel (1998)

.358OB% .288AVG 30 2Bs 6 3Bs 37 SBs


66. Ryne Sandberg (1990)

.354OB% .306AVG 30 2Bs 40 HRs 25 SBs
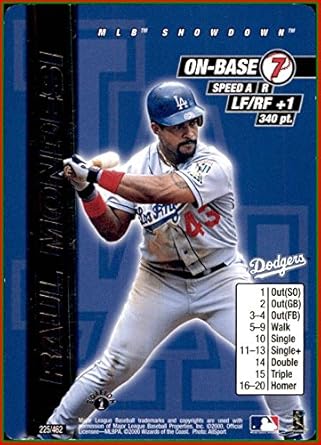
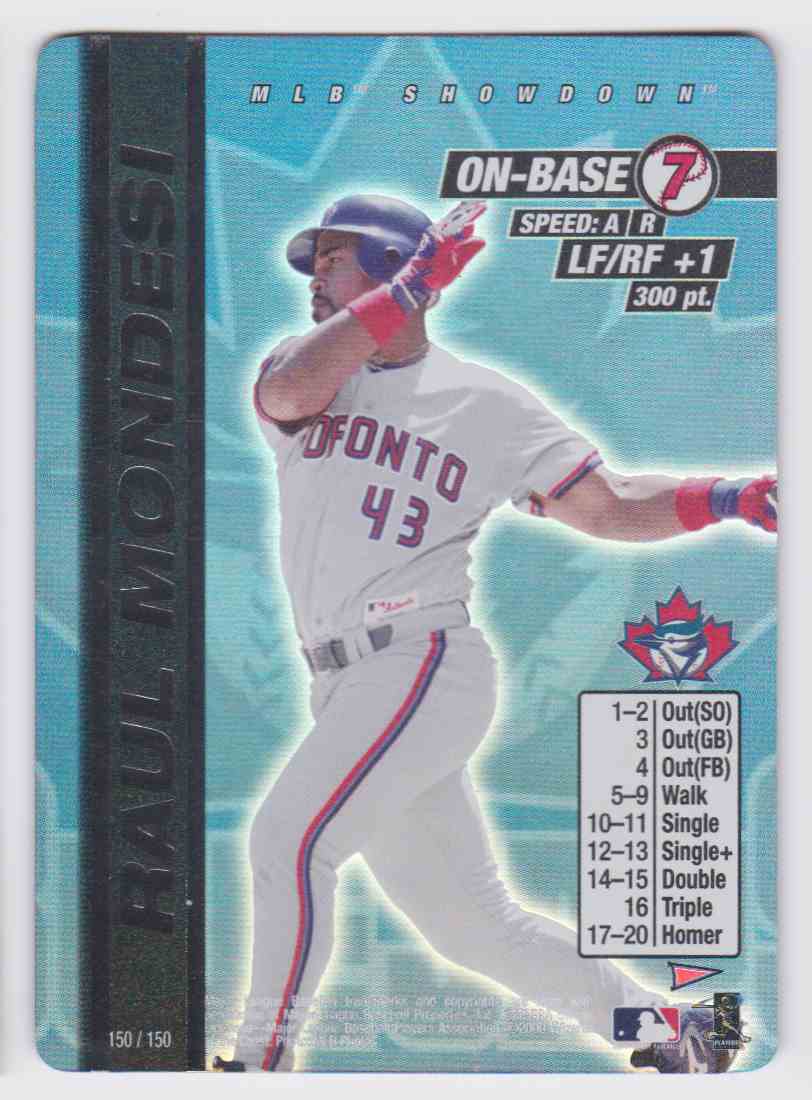
65. Raul Mondesi (1997)

.360OB% .310AVG 42 2Bs 5 3Bs 30 HRs 32 SBs
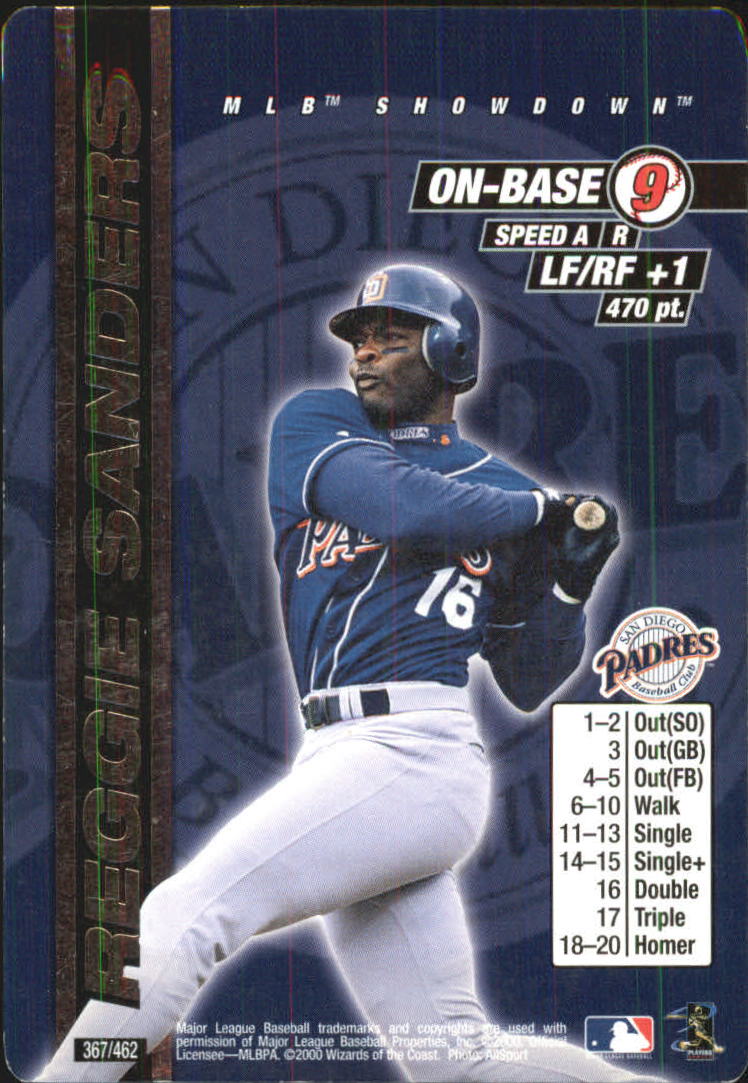
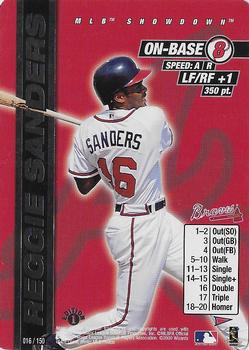
64. Reggie Sanders (1995)

.397OB% .306AVG 36 2Bs 6 3Bs 28 HRs 36 SBs
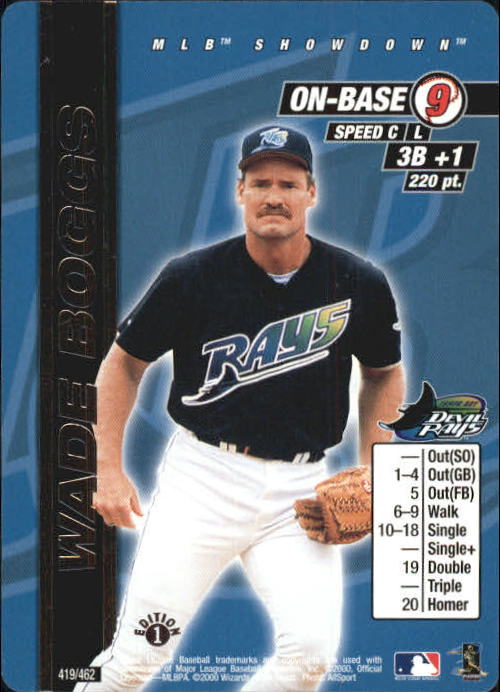
63. Wade Boggs (1991)

.421OB% .332 AVG 42 2Bs
62. Nomar Garciaparra (1997)

.342OB% .306AVG 44 2Bs 11 3Bs 30 HRs 22 SBs

61. Derek Jeter (1996)

.370OB% .314AVG 25 2Bs 6 3Bs 10 HRs


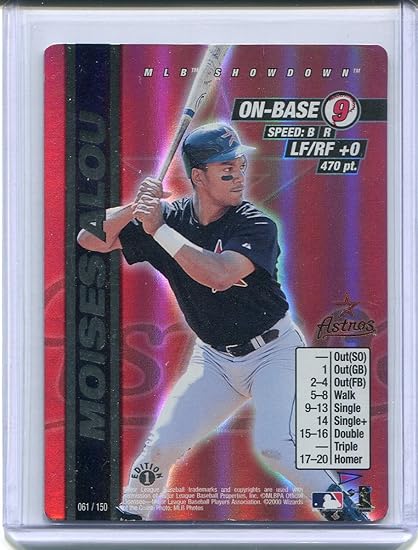
60. Moises Alou (1998)

.399OB% .312AVG 34 2Bs 38 HRs


59. Marquis Grissom (1996)

.349OB% .308AVG 32 2Bs 10 3Bs 23 HRs 28 SBs


58. Vinny Castilla (1998)

.362OB% .319AVG 28 2Bs 4 3Bs 46 HRs

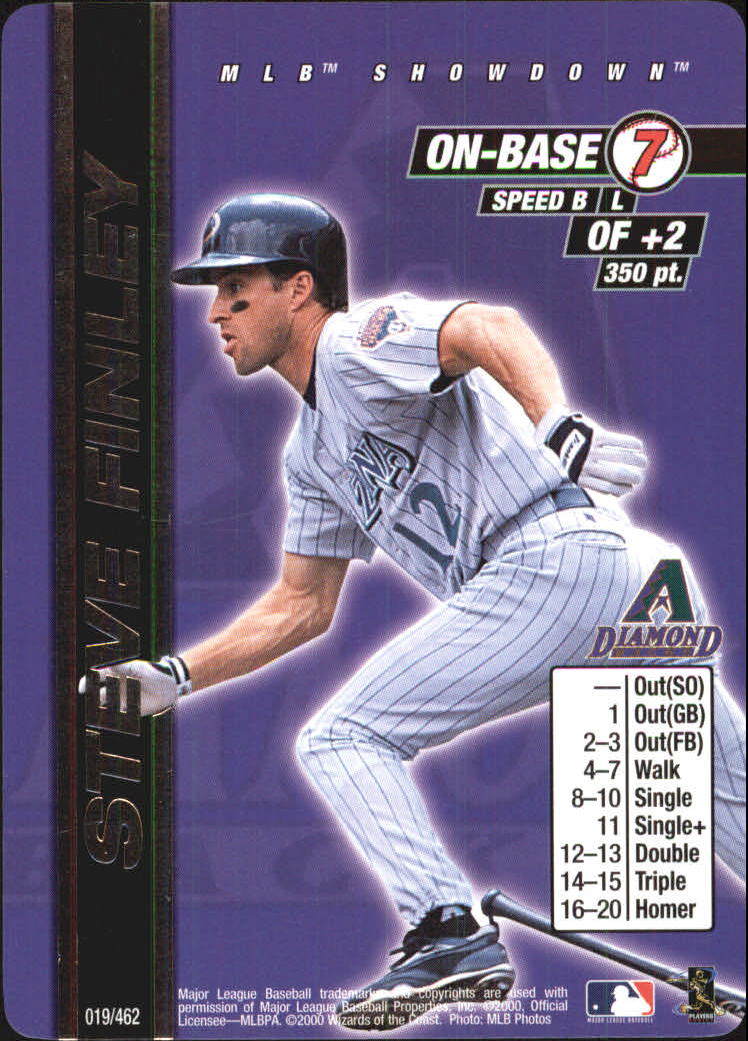
57. Steve Finley (1996)

.354OB% .298AVG 45 2Bs 9 3Bs 30 HRs 22 SBs

56. Tino Martinez (1997)

.371OB% .296AVG 31 2Bs 44 HRs

55. Jay Bell (1993)

.392OB% .310AVG 32 2Bs 9 3Bs 16 SBs

54. Robin Ventura (1996)

.368OB% .287AVG 31 2Bs 34 HRs

53. Rickey Henderson (1990)

.439OB% .325AVG 33 2Bs 28 HRs 65 SBs

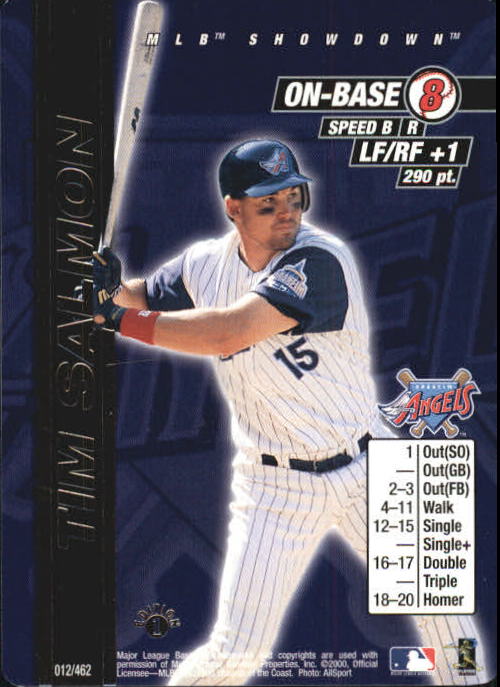
52. Tim Salmon (1995)

.429OB% .330AVG 34 2Bs 34 HRs
51. Chili Davis (1991)

.385OB% .277AVG 34 2Bs 29 HRs

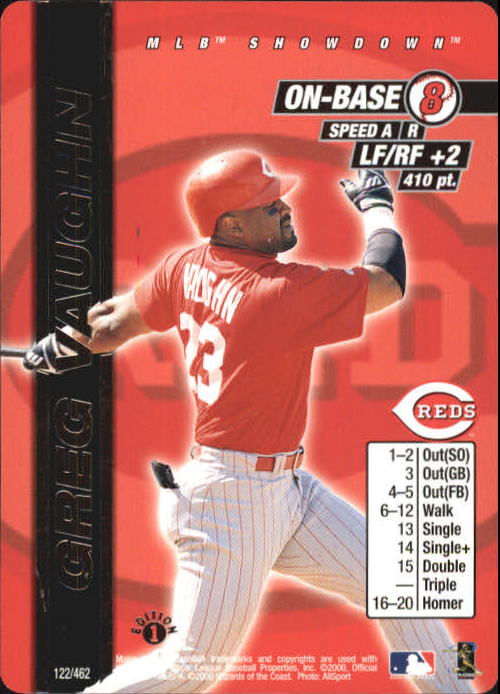
50. Greg Vaughn (1993)

.369OB% .267AVG 28 2Bs 30 HRs


49. Joe Carter (1991)

.330OB% .273AVG 42 2Bs 33 HRs 20 SBs

48. Jose Canseco (1991)

.359OB% .266AVG 32 2Bs 44 HRs 26 SBs


47. Alex Rodriguez (1996)

.414OB% .358AVG 54 2Bs 36HRs 15 SBs
46. Cecil Fielder (1990)

.377OB% .277AVG 25 2Bs 51 HRs
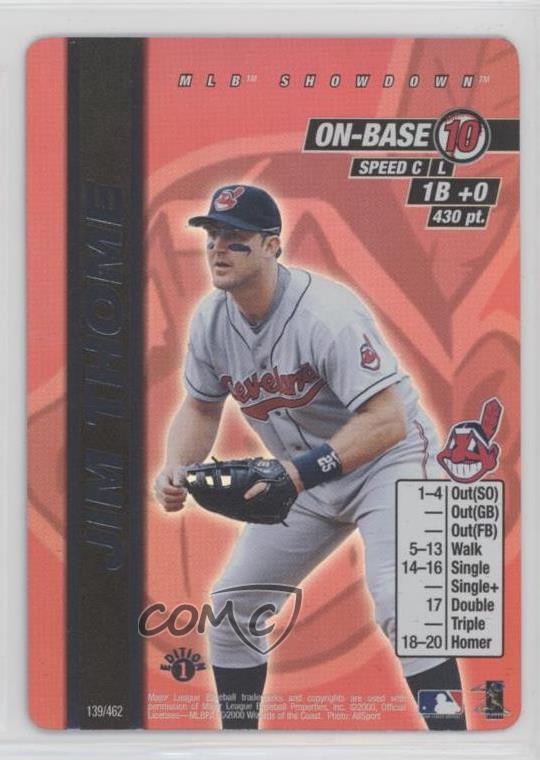
45. Jim Thome (1996)

.450OB% .311AVG 28 2Bs 38 HRs


44. Bobby Bonilla (1990)

.322OB% .280AVG 39 2Bs 7 3Bs 32 HRs

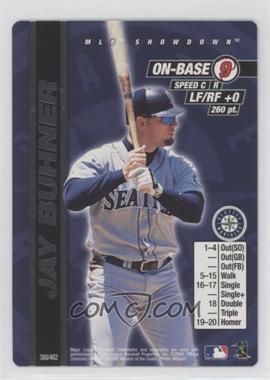
43. Jay Buhner (1996)

.369OB% .271AVG 29 2Bs 44 HRs
42. Kirby Puckett (1992)

.374OB% .329AVG 38 2Bs 4 3Bs 19 HRs 17 SBs

41. Travis Fryman (1993)

.379OB% .300AVG 37 2Bs 5 3Bs 22 HRs

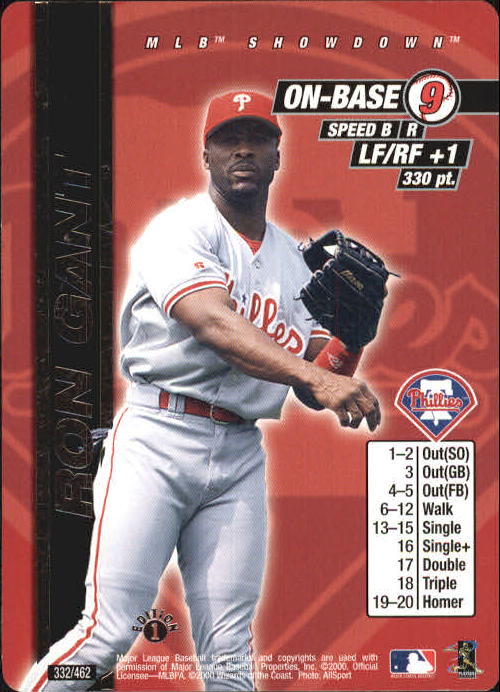
40. Ron Gant (1990)

.357OB% .303AVG 34 2Bs 32 HRs 33 SBs
39. Brady Anderson (1996)

.396OB% .297AVG 37 2Bs 5 3Bs 50 HRs 21 SBs


38. Ken Caminiti (1996)

.408OB% .326AVG 37 2Bs 40 HRs


37. Ellis Burks (1996)

.408OB% .344AVG 45 2Bs 8 3Bs 40 HRs 32 SBs

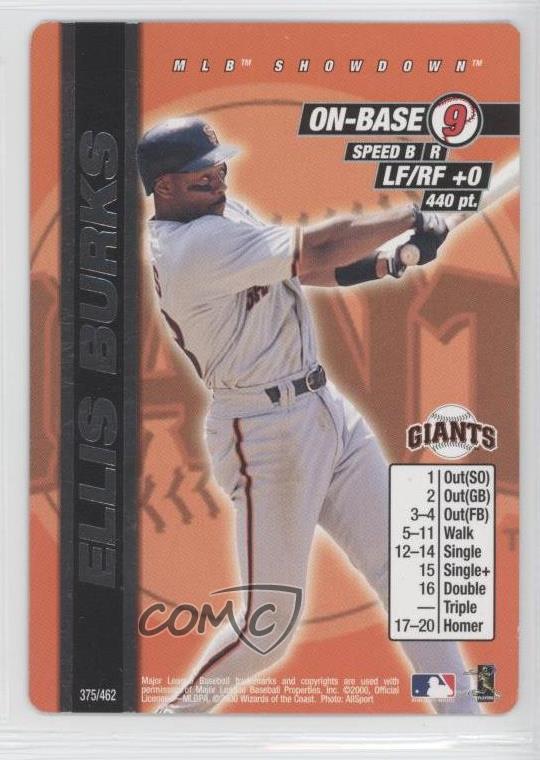
We also have the same year from Bobs Template
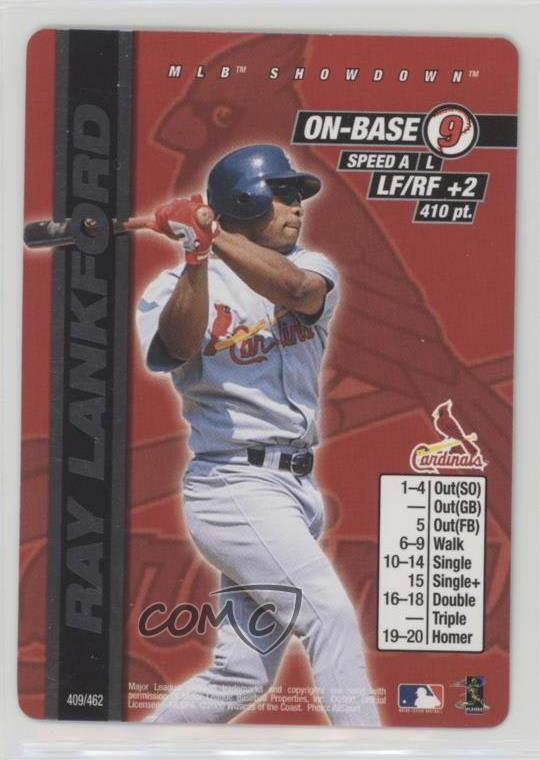
36. Ray Lankford (1997)

.411OB% .295AVG 36 2Bs 31 HRs 21 SBs
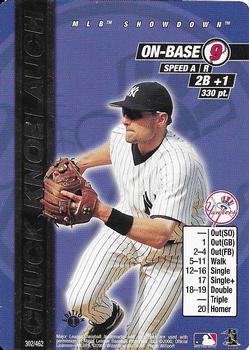
35. Chuck Knoblauch (1994)

.381OB% .312AVG 45 2Bs 35 SBs


34. Chipper Jones (1996)

.393OB% .309AVG 32 2Bs 5 3Bs 30 HRs


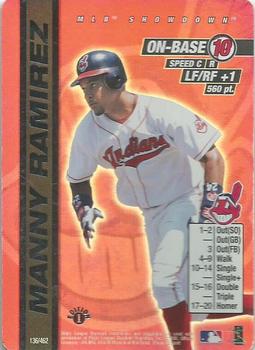
33. Manny Ramirez (1998)

.377OB% .294AVG 35 2Bs 45 HRs


32. Paul Molitor (1991)

.399OB% .325AVG 32 2Bs 13 3Bs 17 HRs 19 SBs

31. Will Clark (1991)

.359OB% .301AVG 32 2Bs 7 3Bs 29 HRs
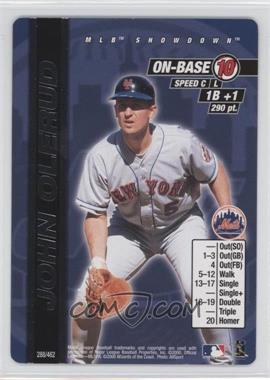
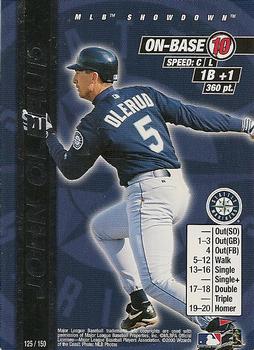
30. John Olerud (1993)

.473OB% .363AVG 54 2Bs 24 HRs
29. David Justice (1993)

.357OB% .270AVG 15 2Bs 4 3Bs 40 HRs


28. Andres Galarraga (1996)

.357OB% .304AVG 39 2Bs 47 HRs 18 SBs


Another card produce by Bob, same season
27. Matt Williams (1993)

.325OB% .294AVG 33 2Bs 4 3Bs 38 HRs


26. Mark Grace (1995)

.395OB% .326AVG 51 2Bs 16 HRs

25. Ivan Rodriguez (1998)

.358OB% .321AVG 40 2Bs 4 3Bs 21 HRs

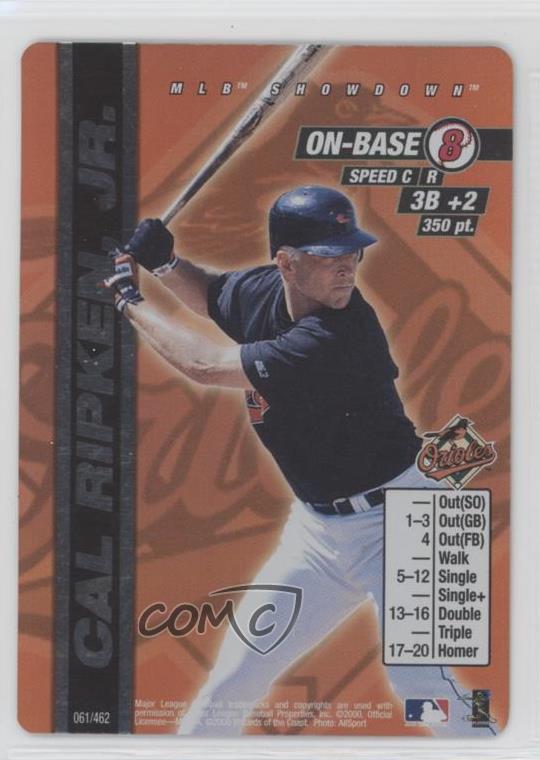
24. Cal Ripken Jr. (1991)

.374OB% .323AVG 46 2Bs 5 3Bs 34 HRs

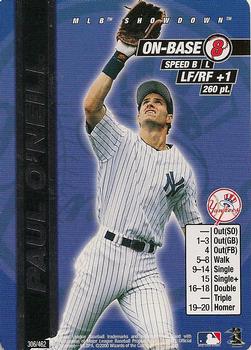
23. Paul O'Neill (1994)

.460OB% .359AVG 25 2Bs 21 HRs

22. Kenny Lofton (1994)

.412OB% .349AVG 32 2Bs 9 3Bs 60 SBs


21. Mo Vaughn (1995)


.388OB% .300AVG 28 2Bs 39 HRs
20. Tony Gwynn (1994)


.454OB% .394AVG 35 2Bs


19. Bernie Williams (1997)


.408OB% .328AVG 35 2Bs 6 3Bs 21 HRs 15 Sbs


18. Dante Bichette (1995)

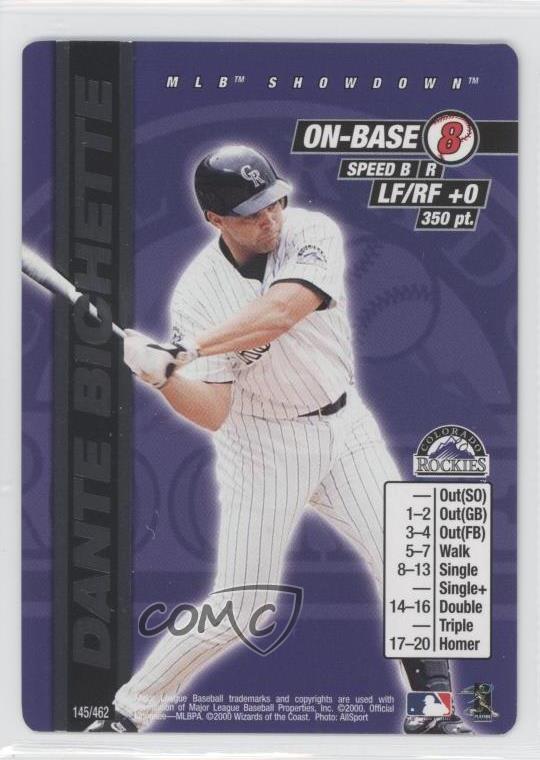
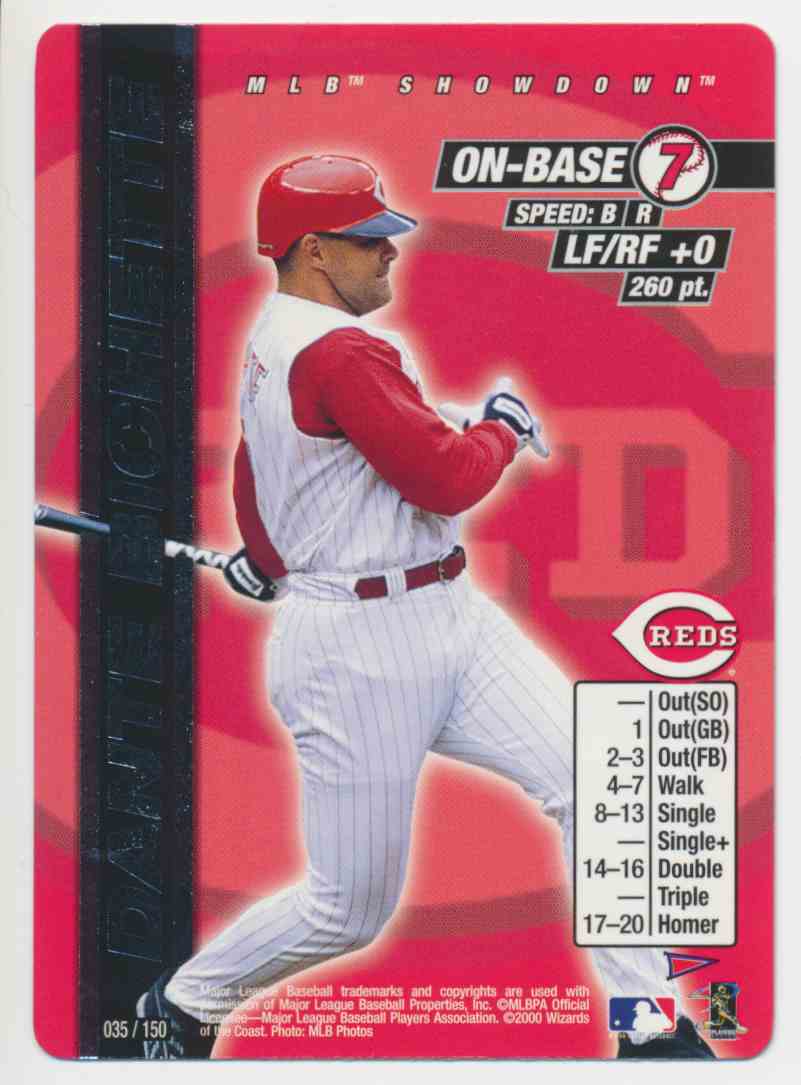

.364OB% .340AVG 38 2Bs 40 HRs
17. Sammy Sosa (1998)

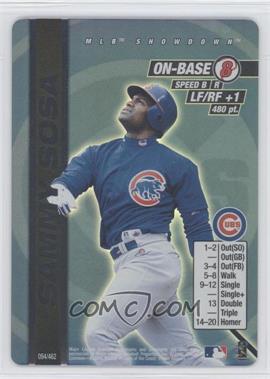

.377OB% .308AVG 20 2Bs 66 HRs
16. Barry Larkin (1995)


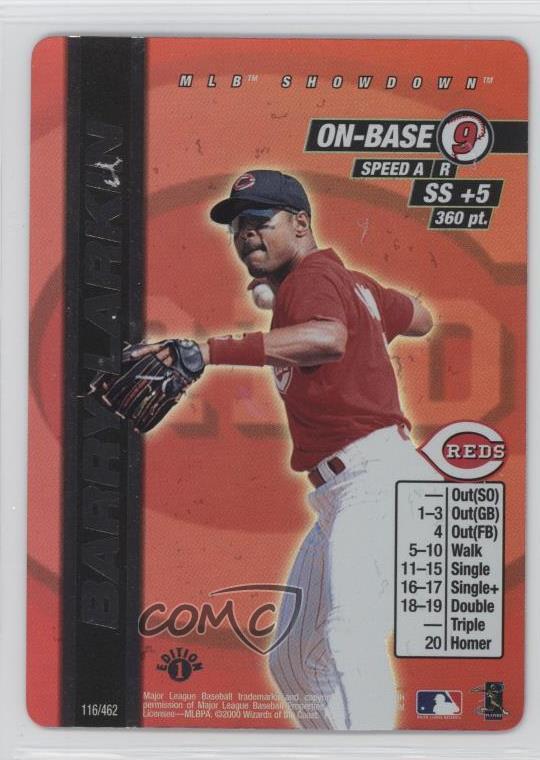

.394OB% .319AVG 29 2Bs 6 3Bs 15 HRs 51 SBs

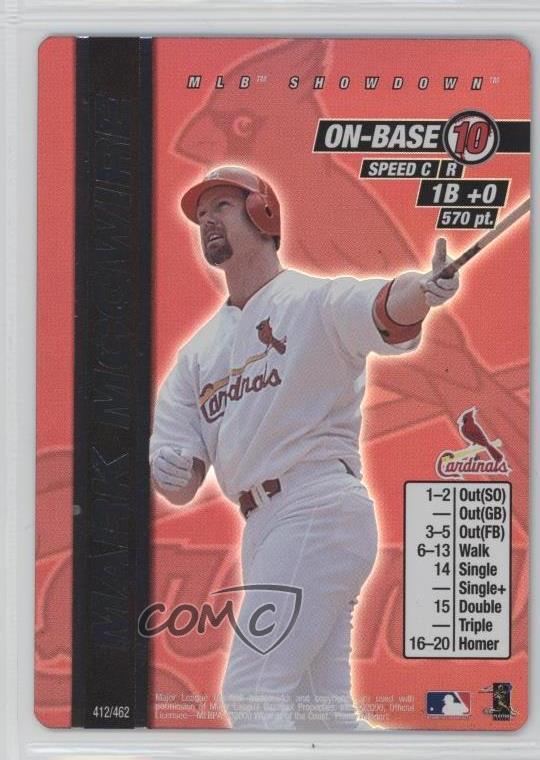
15. Mark McGwire (1998)


.470OB% .299AVG 21 2Bs 70 HRs


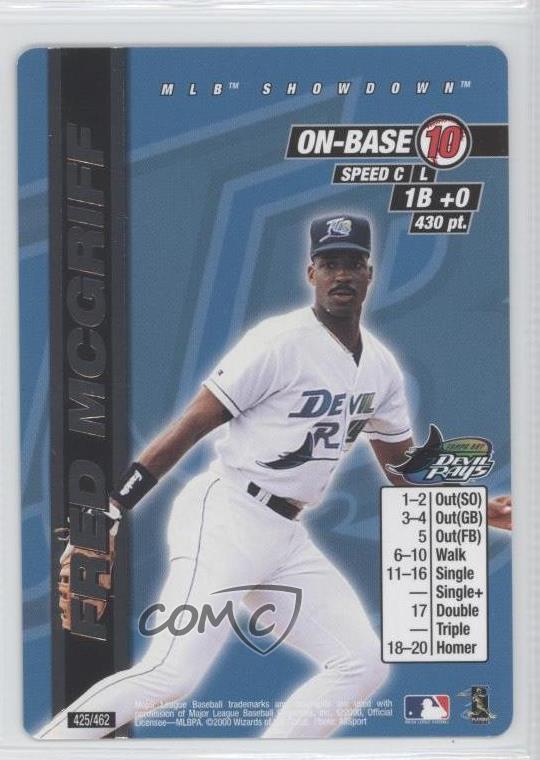
14. Fred McGriff (1992)


.394OB% .286AVG 30 2Bs 35 HRs


13. Craig Biggio (1998)


.403OB% .325AVG 51 2Bs 20 HRs 50 SBs
12. Edgar Martinez (1995)


.479OB% .356AVG 52 2Bs 29 HRs
11. Rafael Palmeiro (1998)


.379OB% .296AVG 36 2Bs 43 HRs


10. Mike Piazza (1997)


.431OB% .362AVG 32 2Bs 40 HRs
9. Gary Sheffield (1992)


.385OB% .330AVG 34 2Bs 33 HRs


8. Juan Gonzalez (1998)


.366OB% .318AVG 50 2Bs 45 HRs
7. Albert Belle (1995)


.401OB% .317AVG 52 2Bs 50 HRs
6. Larry Walker (1997)


.452OB% .366AVG 46 2Bs 49 HRS 33 SBs


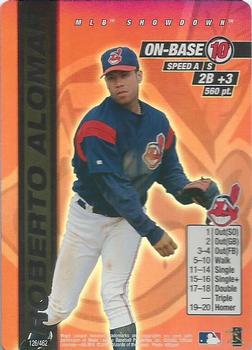
5. Roberto Alomar (1996)


.411OB% .328AVG 43 2Bs 4 3Bs 22 HRs 17 SBs
(S/O Peter for making this card)


4. Jeff Bagwell (1994)


.451OB% .368AVG 32 2Bs 39 HRs 15 SBs


3. Frank Thomas (1994)

.487OB% .353AVG 34 2Bs 38 HRs

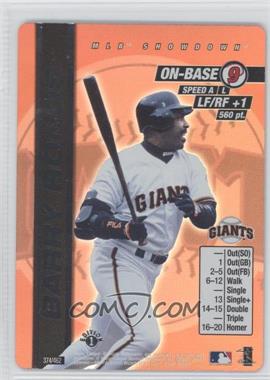
2. Barry Bonds (1992)


.456OB% .311AVG 36 2Bs 34 HRs 39 SBs


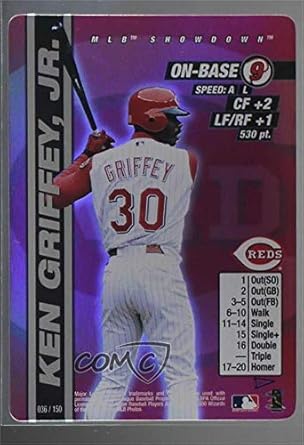
Ken Griffey Jr. (1997)


.382OB% .304AVG 34 2Bs 56 HRs 15 SBs


For anyone that wants to print all these bad boys out, follow this link I copied them into the page that I use to print out cards, they are all set up for you to print and cut out.
https://docs.google.com/document/d/19Bzo9DQNSgjrd-4mJuA0TFHtQINmy45-SPYZpCzHjJI/edit?usp=sharing
I love the work you guys put into these cards, but I've been troubled for some time about the charts and the cost.
ReplyDeleteI'll just use one example: entry #86, Dean Palmer.
In the 1996 season he had 652 plate appearances with 582 at-bats, and hit 26 doubles and 38 homeruns.
In the 1999 season he had 639 plate appearances with 572 at-bats, and hit 27 doubles and 34 homeruns.
The 1996 card is a touch slower than the 1999 card (speed 13 vs 15), and has four outs as opposed to three. However, the 1996 card has better defense (3B+2 vs 3B+1), has four productive outs vs one on the 1999 card (productive outs being GB or FB, since unlike a SO they can advance and/or score runners), singles on an eight vs a nine, and has four doubles vs one.
The two cards cost the same.
If it's by the literal numbers, how does the season he had more walks lead the card to have fewer walk results than the other season? How does the nearly identical number of doubles make four times as many on one card versus the other?
If it's a percentage, the numbers are going to look similar as above, so why the discrepancy?
The only number than pops out between the 1996 and 1999 seasons for Dean Palmer was his onbase percantage of .348 vs .333, but the cards have the same OB 7.
I'm not trying to be argumentative, but I'm wondering if the formula used for making the custom cards doesn't inflate extra-base results and place too little weight from hitting into determining the cost of the card. If I have the chance of drafting between these two, there's little reason to ever take the 1999 one for the same cost as the 1996 one.
It's getting a little weird seeing so many OB 7 and up cards with doubles starting on 12 or lower when it was pretty exclusive to the OB 4, 5 and 6 in the original sets.
Also the original cards placed too little weight on XB hits
DeleteBut also, ironically, Dean Palmer was the only card that I was like "huh" when I saw it -- which speaks to how good Matt's card creating is... dude made 100 cards, with like a 1% HUH? rate!!!
DeletePersonally, Dean would've been 12-14 2B if I had made him (I think my old chart Matt has is more rigid than it should be, and that's my bad). The old game didn't properly account for how infrequently OB 7 guys get their charts, especially in today's game where so many C5 and 6 guys exist. Frankly, pitchers are better than yesteryear, so they've got better cards and OB 7 guys need more "oompf" to their game.
As to the difference in OBP, that's because on-base is determined by how a player does in each season comparatively, plus it's in ranges (so a .348 and .333 guy can both be OB 7).
Also, honestly, the original game is frequently and shockingly inaccurate. Chipper Jones was an 18-20 vs Brian Giles being a 17-20 for HR made no sense, nor did Biggio hitting 56 doubles for only a 17-19 2B range with an OB 9... and it gets wayyyyyyyyy worse as you go on. So we've been working to make it more consistent, especially by making the OB 7 and 8 guys better (in particular, by expanding the OBP ranges with 7 and 8 guys so we have almost no OB 4, 5, or 6 players since they're legit useless and, therefore, unrealistically terrible).
We're going to try to keep improving, but also.... then just draft the 1996 one! Also it's important to point out -- a lot of the cards are made to be played within their season's set, so there's going to be times where a 2019 card is cheaper than a very similar 2018 card, but that's because it's value is worth less compared to the other cards in its set (if that makes sense).
But definitely noted on points (which really are the trickiest thing, but especially like a project where you're making cards across years... it's easy when comparing everyone in a set to distribute points faaaaairly evenly... but almost impossible when just eye-balling it).
Way I look at it -- if someone is underpriced (and it could be way worse, like Saberhagen somehow being worth 430 points rather than 530), they're a steal or undraftable (ala Juan Guzman at 40 points)
Hopefully that was a fairly coherent and thoughtful response? I'm super tired and still so stuffed up on turkey haha!
DeleteBut yeah, long story short -- very fair criticism that we've been working to address for a while, but there'll definitely be cards "better" than others that will be worth more due to (a) year by year skills determining points and (b) adjusting our formulas to try to make them even better than the OG ones (even if there's still been some flaws in the system here and there!).
No, that's answer my thoughts. I have put up on BoardgameGeek a (very) old chart formula I had, and that's comparison is what my thoughts are predicated on.
DeleteI had never considered until now that the old MLB Showdown cards might be flawed in their own right. And I do appreciate that the cards you guys make feel accurate... as compared with the original sets when the foils tended to be the best... it's like they wanted to push those cards to sell booster packs...
;)
Hey bring on the discussions because thats the only way we can make this game better. So when wizards went out of business unfortunately they never gave us a blue print on how they calculated things. When i did this set i followed peters style for charting. The outs based on the OB is ranked with all the other players from teh 1996 season and where he fell in that number. One thing that we have talked about recently is that there are too many doubles. So like you we have noticed that as well, especially in the 7-6-5 OB batters because they get so few charts against average and better pitching. But like i was saying its all trial and error.
ReplyDeleteFor the points, this has been the part i struggled with the most when making cards. Much like the players charts it would have been great to know how they calculate points. I have all the cards that have been made from this site, the other site, and the original 00-01 cards in a spreadsheet, so I sort by stats for charts until i find a comparable one and go with those points. I think i tried to remember everything you said when writing this lol, if i forgot i apologize, but have no problem continuing the conversation, because at the end of the day were just trying to make the game better
Look great and great idea. I was doing this very thing for my cards. One thing I noticed was that you had an early 90's Ripken at 3B. Silken was SS all the way until I want to say 97 maybe 98.
ReplyDeleteThanks for pointing that out, I musta brain farted because even in my sheet I have him as ss+3
DeleteGod this entire page is amazing. I'm going to give some quick analysis overviews:
ReplyDeleteMcGwire's '98 card is the best card on here at a ridiculous 8.18 expected runs, with his '96 a half run back. Bonds '93 is right behind his '96. Henderson '90 and Larry Walker 1997 both come in over 7. Piazza is going to be a contender for top all time catcher at 6.86 expected runs. Brady Anderson might be the top 9 OB card of all time at 6.72 expected runs. BJ Surhoff is unsurprisingly the worst card at 2.13 runs- a full run behind Shawn Green's 6 OB 1998 card.
I have all the cards sorted into my spreadsheet so if you have any one off comparisons you want me to make, drop me a reply and I'll get them for you
You're so so so right about Brady Anderson -- I think he's going to be foundational to my team building from now on, I think even at 610 points he's a real bargain!
DeleteThis whole post is great. I remember playing the game when it first came out in 2000, but being sad that the best players of the previous few seasons were either retired or declining. So to have those guys in their prime is amazing.
ReplyDeleteI don't know if you are planning on a pitchers post as well, but either way... this is awesome work.
Lindblom is attempting said comeback with the Milwaukee Brewers, yet he doesn't appear anywhere on their virtual rotation. The Dodgers were hit particularly hard by these omissions, as they lost not only their top infield prospect, but also one of their best pitching prospects in Tony Gonsolin, although their rotation still looks stacked, even without the cat-shirt enthusiast. Going out of order here, the only dedicated reliever on this list is James Karinchak, who spent some time as a closer in Cleveland's minor league ranks in 2019.
ReplyDeleteI skipped to Karinchak above because I want to group the next two pitchers together. Kwang Hyun Kim and Shun Yamaguchi both spent their careers to date pitching in overseas leagues - the former in the KBO and the latter in the NPB - but are scheduled to make their major league debuts whenever the season gets underway. Both pitchers are also looking at rather unsettled roles: had the season opened as planned, Kim was all but assured a spot in the Cardinals' rotation, due to an injury to Miles Mikolas. But with the delayed start to the season giving the returning expat additional time to recover, Kim could be ticketed for starting Website Website Website Website Website Website Website his MLB career with a bullpen role. Yamaguchi has actually had success as both a starter and a reliever in Japan, and given the lengths to which Toronto went to improve their pitching staff in the offseason, it was always rather unlikely that Yamaguchi would start the year in the rotation. In the lone Fantasy Astrology reference I'll make in this post, both of these pitchers represent the Cancer Crabs, a sign that has historically lacked depth in the starting pitching department.