For anyone interested in the article, here is the link
2010's All-Decade Team:
C: Buster Posey 42.2 WAR

1B: Joey Votto 52.1 WAR

2B: Robinson Cano 54.2 WAR

SS: Francisco Lindor 28.6 WAR

3B: Adrian Beltre 51.0 WAR

LF/RF: Mookie Betts 42.0 WAR

CF: Mike Trout 72.5 WAR

LF/RF: Andrew McCutchen 41.2 WAR

DH: Miguel Cabrera 43.5 WAR

SP: Clayton Kershaw 59.3 WAR

SP: Justin Verlander 56.2 WAR

SP: Max Scherzer 56.1 WAR

SP: Madison Bumgarner 32.2 WAR

SP: Chris Sale 45.4 WAR

RP: Craig Kimbrel 19.6 WAR

2000's All-Decade Team:
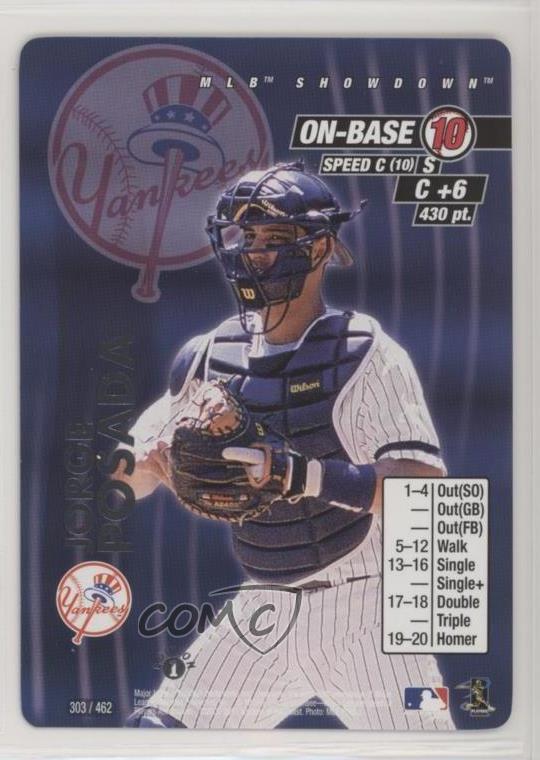
C: Jorge Posada 37.5 WAR

1B: Albert Pujols 73.8 WAR

2B: Chase Utley 42.2 WAR

3b: Alex Rodriguez 77.7 WAR

SS: Derek Jeter 44.1 WAR

LF/RF: Barry Bonds 59.1 WAR

CF: Carlos Beltran 51.4 WAR

LF/RF: Ichiro Suzuki 51.1 WAR

DH: Chipper Jones 50.6 WAR

SP: Randy Johnson 51.3 WAR

SP: Johan Santana 46.2 WAR

SP: Curt Schilling 46.2 WAR

SP: Pedro Martinez 45.6 WAR

SP: Roy Halladay 45.4 WAR

RP: Mariano Rivera 33.0 WAR

1990's All-Decade Team:
C: Mike Piazza 41.6 WAR

1B: Jeff Bagwell 56.9 WAR

2B: Roberto Alomar 45.6 WAR

3B: Robin Ventura 46.1 WAR

SS: Barry Larkin 52.6 WAR

LF/RF: Barry Bonds 80.2 WAR

CF: Ken Griffey JR 67.5 WAR
LF/RF: Larry Walker 47.8 WAR

DH: Frank Thomas 52.8 WAR

SP: Greg Maddux 65.4 WAR

SP: Roger Clemens 68.1 WAR

SP: Randy Johnson 52.1 WAR

SP: David Cone 52.9 WAR

SP: Tom Glavine 52.9 WAR

RP: John Wetteland 17.9 WAR
Probably should have made Wetteland's card like I did for the Pirates closer this past season.
So those are the three teams, who do you think has the best overall squad? go to my twitter page and vote in the poll of who you would choose @mlbshowdowncup


Best lineup: the 1990s team takes the cake here even without the juiced up McGwire or Sosa included. It's close though as the total expected runs are 57.16 for the 90s, 55.05 for the 10s and 54.59 for the 00s. Ventura is the worst card here at 4.48 expected runs and Lindor is the only other under 5 expected runs. Each team features someone over 7 expected runs: Trout at 7.13, Bonds at 8.40 and Larry Walker at 7.13. The 90s also have Bonds and BAgwell over 6.90 and Piazza just shy at 6.89.
ReplyDeletePitching Staff: OH BOY THIS IS A CLOSE ONE. The 00s come out on top at 27.714, 90s at 27.76 and 2010s at 27.88. If you add in closers it's still close but not as close with Mariano being .22 better than Wetteland who is another .20 better than Kimbrel.
Overall this leads to the 90s being the top team here! Second is the 2000s and final is the 2010s.
Adding to that: Pedro 2001 is the top card here at 4.88 expected runs, and is the only card under 5. Kershaw and Mariano have identical cards from an expected runs chart and are just ahead of MAddux's card. Both of Randy's cards come in in the 5.30 range which is wild. Mad Bum is the worst card at 6.23 and Santana is the only other pitcher over 6 at 6.06
ReplyDeleteThats the type of analysis i love to see, Truly tons of studs to used. What were the overall totals, do you just add the offense and pitching together?
ReplyDeleteYou can't truly just add them together because for pitchers you want lower totals and hitters you want higher but just used the difference between each to crown the 90s the top team, so i guess one way to do it would be to subtract the pitcher totals from the hitters total so you'd then want the highest number possible.
ReplyDeleteIn that scenario you get this
90s: 57.15871-33.03551= 24.1232
00s: 54.59166-32.76521= 21.82645
10s: 55.05329-33.36177= 21.69152
Not exactly perfect but IMO their offense is enough better than the others and their pitching is in the same ballpark so I'd take them
And here I figured it was the 90s lineup because of the high-onbases with power and half the lineup only having 2 outs. Your answer's a lot more specific lol. Plus only 1 90s starter allows a double, which can help stifle a big innning if you roll natural 20's on the pitcher's chart.
ReplyDeleteAlso, I'm personally amused that the 00s team has to put either A-Rod or Jeter in the DH slot because they can't both be SS at the same time.
So that really is the nail on the head though. Basically my calculations just assign a run value based on real MLB stats to each outcome and then you calculate the outcome for each batter against an average pitcher and vice versa. So what ends up being the biggest factors are their OB and their outs. Since outs vary from being negative runs (strike outs, pop ups, double plays) to potentially positive (sack flies, etc) they get cancelled out as 0 runs- meaning the more opportunity you have to be productive the better you are as a player.
ReplyDeleteI'd definitely rather have the 90's team I can't believe that Bonds had an 80.2 WAR for ten years!!
ReplyDelete